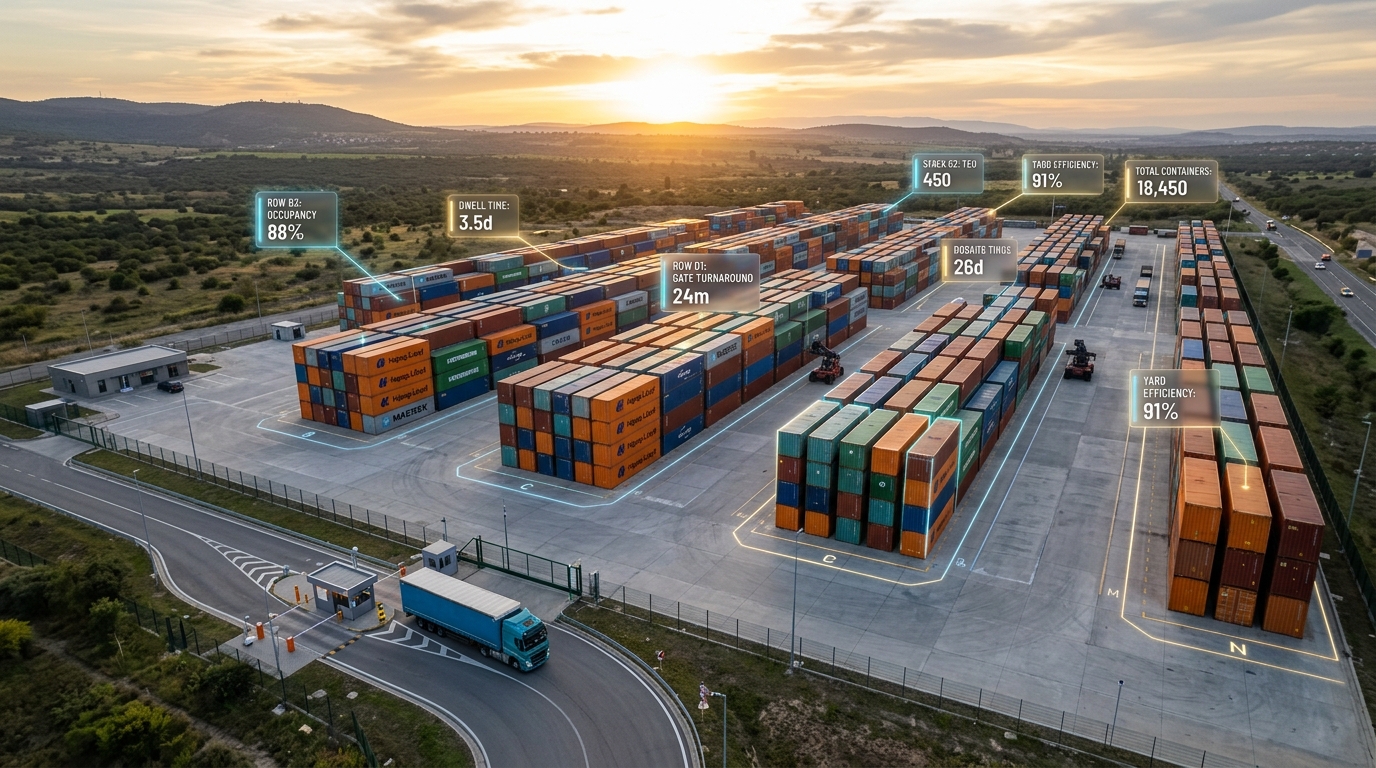
A truck waits 18 minutes at the gate because someone is retyping an 11-character container number from a scratched door. A box sits in the yard for nine days, but storage is charged for six because the arrival timestamp was copied late. A customer disputes a repair because the gate-in photos are stuck on one inspector’s phone. These small failures are exactly why tracking container yard KPIs matters.
Container yard KPIs are the operational metrics that track gate time, dwell time, inspections, and billing accuracy. They show where time, capacity, and revenue are being lost.
Most depots already have the data. The problem is that it’s scattered across clipboards, WhatsApp threads, Excel files, and operator memory. By the time it becomes a report, it’s too late to act.
This guide breaks down the KPIs that matter, where the data comes from, and how to track them without adding more admin work.
What Are Container Yard KPIs?
Container yard KPIs are operational measures that show how well a depot moves, stores, inspects, repairs, releases, and bills services.
They help managers answer practical questions:
- Are trucks moving through the gate quickly?
- Are containers sitting too long?
- How many containers are not available?
- Can the yard map be trusted?
- Are repairs moving fast enough?
- What is the average revenue per customer?
- Can invoices stand up to customer disputes?
The best KPI programs do not start with a dashboard. They start with the daily workflow.
When teams capture timestamps, photos, yard positions, and service records while the work happens, KPI data stays reliable. It becomes a byproduct of operations, not another admin task.
Why Container Yard Performance Metrics Tracking Fails
Picture a common Monday morning at an inland depot. A carrier disputes storage charges on a container that left Friday afternoon. The invoice says the unit spent eight chargeable days in the yard. The carrier says it should be five.
The billing team pulls the spreadsheet. The gate-in time was entered at 10:14, but the gate clerk remembers writing it on a clipboard before lunch because the system was not open at the gate. The gate-out record came from a paper interchange form. The yard supervisor thinks the box was moved twice before release, but only one move made it onto the whiteboard. The customer asks for proof. Now the depot is no longer discussing performance. It is reconstructing a week from fragments.
This is where KPI tracking breaks down. Not because depot managers do not care about metrics, but because the source data is weak. A clipboard timestamp may be good enough to keep the line moving, yet it is a poor foundation for billing, dwell analysis, and customer disputes. A yard position written down after the move may be close enough until a driver is waiting and the box is not where the system says it is.
Once the data is scattered, every KPI becomes an investigation. Average dwell time requires gate-in and gate-out dates for every released unit. Gate turnaround requires reliable arrival and exit timestamps. Billing accuracy requires matching service records, photos, storage days, and invoice lines. When each number takes 30 minutes of spreadsheet work, managers stop asking for the number unless there is already a problem.
The answer is not to tell teams to track harder. The answer is to capture cleaner operational data at the moment the work happens.
Where Container Yard KPIs Data Comes From
Good Container Yard KPIs are built from ordinary depot events. A truck arrives. A container is photographed. A number is read. An inspection is completed and an EDI is sent. A box is placed in a slot. A repair estimate is sent (EDI). A unit is released. Each of those events can produce a timestamp, a status, a location, and a record that another team can trust.
At the gate, OCR can read the container number from a tablet photo, record the arrival time, link the truck and booking details, and start the inspection record without retyping. That one event feeds gate turnaround, dwell time, billing, and customer visibility.
During inspection, a tablet-based workflow can prompt the inspector to capture each side of the container, record damage type and location, and connect the photos to the unit file. That makes inspection completion, damage detection, EMR response time, and later billing evidence much easier to see.
In the yard, a mobile position update can show that a container moved from Bay 12 to Bay 15, not after the shift, but while the move is being completed. The yard map becomes a working picture of the depot instead of a hopeful approximation.
The pattern matters. A depot should not have to stop operating in order to measure itself. The strongest KPI data comes from gate-in, inspection, yard move, repair, release, and billing workflows that create records as part of the job.
The 10 Container Yard KPIs That Matter
The following KPIs are not a universal scorecard. Depot layout, volume, customer mix, stacking rules, labor model, equipment, and transport flows all change what good looks like. The targets below are practical starting points based on typical inland depot operations and on depots that tend to perform well, not fixed industry laws.
1. Gate Turnaround Time
Gate turnaround time measures the minutes between truck arrival and gate exit, both for inbound and outbound moves. It is one of the most visible KPIs in the yard because everyone can see the queue. Drivers see it. Customers hear about it. Managers feel it before they see the report.
Based on typical inland depot operations, many well-run small and medium depots try to keep gate-in under 10 minutes and gate-out under 5 minutes. The exact number depends on inspection requirements and traffic pattern, but the direction is clear: long gate times usually mean the team is doing too much manual work at the most congested point in the operation.
The delay builds through small handoffs: the container number is retyped, the booking is checked in another system, the interchange form is still pending, and a supervisor is pulled in to validate an exception. None of these steps is unreasonable on its own, but together they turn the gate into a bottleneck.
A tablet-first gate workflow changes the source of the delay. OCR reads the container number from a photo, the system logs the timestamp, and inspection evidence is captured on the same device. Shipzzer, for example, uses this kind of gate workflow so turnaround time is visible by day, shift, or operator without a separate report. The point is not the dashboard itself. The point is that the queue stops depending on retyped data.
2. Container Dwell Time
Container dwell time measures how long a container stays in the yard before collection or release.
It is:
- A space KPI
- A customer communication KPI
- A billing KPI
For many small to medium inland depots, an average dwell time of 3 to 5 days is a reasonable baseline for loaded containers. Empty containers typically have a longer turnaround time.
Containers sitting beyond seven days often need attention. Not because seven is a strict rule, but because long dwell usually signals:
- Customer delays
- Documentation issues
- Repair holds
- Release problems
- Poor communication
The financial risk is simple.
If arrival dates are not captured reliably, storage billing becomes fragile.
The depot may:
- Undercharge by missing billable days
- Overcharge and trigger disputes
Dwell time is where operational sloppiness quietly becomes revenue leakage.
How to calculate dwell time
Dwell time = Gate-out date − Gate-in date
The formula is simple. The challenge is trusting both timestamps.
When gate-in and gate-out events are captured directly during operations, managers gain real visibility:
- Average dwell for released containers
- Containers exceeding thresholds
- Three-month dwell trends
- Dwell time by customer
That last view is often the most valuable.
If one customer averages nine days while others average four, the issue may not be yard capacity. It may be a workflow or communication gap that needs fixing.
3. Yard Occupancy Rate
Yard occupancy rate measures how much of your usable yard capacity is currently in use based on actual stacking rules/bays height.
For small and medium depots, this is not about theoretical capacity. It is about what the yard can actually handle in daily operations.
A depot may look like it can store 1500 containers on paper. In reality, usable capacity is lower once you account for:
- Access lanes for trucks and equipment
- Repair and inspection zones
- Customers/Shipowners specific areas
- Empty container stacks
- Reefer/PTI points
- Hazardous cargo segregation
- Staging areas for pickups and releases
- Customer-specific stacking rules
This is why practical capacity matters more than theoretical numbers.
What is a healthy occupancy level?
Depots that run smoothly often operate within a 40% to 50% occupancy range.
This leaves enough space for:
- Late arrivals
- Staged releases
- Priority moves
- Unexpected exceptions
Below that range, space may be underused.
Above 65%, problems usually start to appear:
- Slower container retrieval
- More rehandles/Parasitic or Extra moves
- Congestion in key zones
- Less flexibility when trucks arrive out of sequence
How to calculate yard occupancy
Occupancy (%) = (Containers in yard ÷ Practical capacity) × 100
The formula is simple.
The real value comes from seeing this number live, not at the end of the month.
What occupancy really tells you
When tracked in real time, occupancy becomes a decision tool.
It helps managers see:
- Whether the yard is truly full or just poorly organized
- Which zones are under pressure
- Where planning or stacking rules are creating bottlenecks
For example, a depot running at 65% occupancy may not be evenly full.
Two blocks may be congested because export empties are still stacked under outdated rules, while another area sits half-used after a change in customer pickup patterns.
Why real-time visibility matters
Occupancy becomes actionable only when yard positions are reliable.
When every container move updates the yard map in real time, managers can:
- Spot congestion before it slows operations
- Rebalance space across zones
- Separate real capacity issues from planning problems
Without that visibility, occupancy remains just a number.
With it, it becomes a way to control flow, not just measure it.
4. Container Positioning Accuracy
Positioning accuracy measures how often the system location matches the container’s actual position in the yard.
It is the trust KPI.
When accuracy is high, operators drive directly to the slot.
When it is low, the yard becomes a search operation.
What is a good positioning accuracy?
Depots with strong yard control often aim for above 95% accuracy.
That may sound ambitious. But the last few percentage points are where the most expensive errors happen.
When a container is not where the system says it is, the impact spreads quickly:
- Slower gate turnaround
- Lower equipment productivity
- More internal calls
- Potential errors at Gate-out
- Driver frustration
Why positioning errors happen
Most errors are not complex.
They usually follow a simple pattern:
- A container is moved quickly
- The operator plans to update later
- The update is delayed or missed
- Another move happens before the system is corrected
By the time the office checks, yesterday’s map is pretending to be today’s reality.
What it looks like in practice
A truck arrives for a container marked as ready in Bay 4.
The operator drives there and finds a different unit in the slot.
Now the search begins.
After 10–15 minutes of calls and guesswork, someone remembers the container was moved during a disruption the day before.
How to calculate positioning accuracy (optional KPI)
Accuracy (%) = (Correct positions ÷ Total positions checked) × 100
The formula is simple.
The challenge is keeping the data correct in real time.
Why real-time updates change everything
A live mobile workflow closes the gap between movement and data.
When the operator confirms the new position at the moment of movement:
- The yard map/inventory updates instantly
- The gate sees the correct location
- The office works with reliable data
- Billing and customer service stay aligned
The best positioning KPI is not a monthly audit score.
It is the absence of people asking:
5. Yard Move Efficiency and Rehandle Rate
Yard move efficiency compares productive moves with parasitic moves.
Productive moves support the job, such as:
- Gate-in placement
- Gate-out retrieval
- Planned repositioning
- Inspection movement
- EMR/Repair flow
Parasitic moves are the moves nobody wanted.
They happen when teams must shift containers because a target unit is blocked, a location is wrong, or a box was placed without considering its departure timing.
The word parasitic is useful because these moves feed on the operation. They consume equipment hours, fuel, labor, and attention without adding value.
For many small and medium depots, keeping parasitic moves below 20% can be a useful internal target. Once they climb higher, the yard starts spending a visible part of the shift undoing yesterday’s placement decisions.
Parasitic moves usually come from predictable causes:
- Long-dwell containers blocking short-dwell units
- Containers not grouped by customer, size, status, or expected departure
- System locations that operators cannot trust
- Stacking rules that live in a supervisor’s head, not in the workflow
A late-afternoon release can expose the problem quickly.
The target container is due at the gate in 20 minutes. But three long-dwell units are sitting in front of it.
One planned retrieval becomes four moves and a delayed driver.
Reducing parasitic movement is not about telling operators to be more careful.
They need visibility before they place the box.
A yard system that shows dwell status, customer grouping, release expectations, and available slots helps the team avoid creating tomorrow’s rehandle while solving today’s move.
6. Inspection Completion Rate
Inspection completion rate measures whether required inspections actually happen.
These may include:
- Gate-in inspections
- Pre-delivery checks
- PTI
- Repair-related inspections
- Customer-specific checks
For gate-in inspections that require evidence, the only credible target is 100% completion.
One missed unit can become the container everyone argues about later.
Missed inspections create expensive ambiguity.
A customer may claim damage happened while the container was in the depot. The depot may believe the box arrived damaged.
Without timestamped gate-in photos, both sides are arguing from memory. That is a weak position, especially when the repair cost is higher than the time needed to document the unit properly.
Picture a driver arriving just before lunch with three empties and a line forming behind him.
The team inspects the first two units, then lets the third through without photos to clear the gate.
That shortcut can become expensive later.
Supervisors, billing, and customer service may all spend time reconstructing what should have been captured in 90 seconds.
The key question is simple:
Can the workflow allow an inspection to be skipped?
If the gate can advance without photos, skipped inspections will eventually happen under pressure.
If photos are mandatory and attached to the gate-in record, evidence becomes part of the movement.
It is no longer an optional admin step.
7. Damage Detection Accuracy
Damage detection accuracy measures how much visible container damage is identified during the initial inspection, rather than discovered later.
It is not a perfect KPI.
Some damage is hidden. Some defects only appear during handling, cleaning or repair.
But for visible external damage, many depots aim for above 85% detection as an internal benchmark.
When damage is discovered late, the conversation shifts from repair planning to blame.
Why this KPI depends on behavior
Damage detection accuracy is closely tied to how inspections are performed.
A rushed visual check at the gate will miss more than a structured, photo-based process.
When inspectors are prompted to:
- Capture all sides of the container
- Mark damage locations
- Follow a consistent sequence
They naturally slow down and observe more carefully.
The camera does not replace judgment.
It slows the process just enough to create reliable evidence.
What happens when damage is missed
A corner post dent missed at gate-in may only surface two days later when the container is staged for collection.
By then:
- The customer wants to know when the damage occurred
- The yard team wants to know who handled it
- The depot has less proof to support its position
What should have been a simple record becomes a dispute.
Why early evidence matters
The value of this KPI appears later in the workflow.
Timestamped photos support:
- EMR quotation
- Customer communication
- Billing accuracy
In a depot, evidence has a half-life.
Capture it at gate-in, or expect it to decay into opinion.
8. EMR Quote Response Time
EMR quote response time measures the number of hours between the damage inspection — or a failed PTI for reefers — and the moment the repair estimate is sent to the customer.
This KPI matters because repair work is both operational and commercial.
Shipping lines and container owners want:
- Speed
- Clarity
- Cost control
A depot that takes two days to send a quote can lose work to a competitor that responds in four hours, even if its repair pricing is fair.
With manual workflows, 24 to 48 hours is still common in many depots.
The delay usually comes from moving information between:
- Inspection notes
- Damage photos
- Parts pricing
- Estimate templates
- Approval channels
- Customer communication
Every handoff adds a place for the quote to sit.
A stronger workflow connects the inspection directly to the estimate.
Damage photos, repair locations, repair codes, parts pricing, and labor lines should not need to be rebuilt after the inspector leaves the container.
In Shipzzer’s EMR workflow, inspection data flows directly into quote creation and delivery, so teams can send estimates without re-entering information.
But the bigger principle is simple:
The quote clock should start and stop inside one traceable process.
The dashboard should show:
- Average quote response time
- Longest pending quotes
- Quotes stuck by status
Averages are useful. But the oldest unresolved estimate is often where the customer pain is sitting.
9. Billing Accuracy Rate
Billing accuracy rate measures the percentage of invoices issued without error, correction, or dispute. It is one of the clearest financial KPIs in a container depot because bad billing does not only delay payment. It burns staff time and weakens customer confidence.
Many depots target billing accuracy above 95 percent, but the better question is what makes the remaining 5 percent fail. Manual container number entry creates typos. Disconnected systems leave gate data in one place and invoice work in another. Missing service documentation makes repair charges hard to defend. Weak timestamps create storage arguments.
Billing improves when invoice lines are supported by operational records. Gate-in and gate-out timestamps support storage days. Inspection photos support damage and repair claims. EMR records support estimate and approval history. Yard and service events support special handling charges. Shipzzer connects these records so invoices can be built from depot activity rather than recreated after the fact.
The customer portal side matters too. When customers can see status, service history, photos, and invoice details without emailing the depot, disputes often become shorter and less
10. EDI Accuracy Rate
What it measures:
Percentage of EDI messages transmitted without errors — across container movements, repair quotes, and status updates sent to shipping lines, clients, and billing or accounting systems
Why it matters:
An EDI error isn’t just a technical glitch. It’s a billing delay, a disputed quote, and sometimes a container that has already left your yard while your depot is still waiting to get paid.
Benchmark target:
Target as close to 100% as possible — every rejected message is a delayed invoice
Calculation: (EDI messages accepted without error ÷ Total EDI messages sent) × 100
Where errors come from:
- Manual data entry before transmission (wrong container number, wrong ISO code)
- Outdated client contract parameters applied to quotes
- Missing or incorrect CEDEX damage codes
- Wrong EDI format for a given shipping line (EDIFACT vs. ANSI X12)
- Disconnected systems where data is re-entered instead of flowing automatically
The cash flow impact:
A rejected EMR quote delays the entire invoicing cycle. Your team corrects the file, resubmits, and waits for revalidation. That can take several days. Meanwhile, the repair is complete, the container is gone, and the invoice is stuck.
The depot did the work. But without a clean EDI chain, you don’t get paid.
How integrated EDI transmission eliminates errors:
With Shipzzer, EDI messages are generated automatically from data captured on the tablet — not typed manually by a back-office team:
- Container number read via OCR → flows directly into EDI message (no retyping, no double entry)
- Damage codes selected on the tablet via the repair interface → standardized CEDEX codes applied automatically
- Client-specific pricing rules applied at quote generation → no manual adjustments needed
- EDI format configured during onboarding per shipping line (EDIFACT, ANSI X12, API, FTP, SFTP, email) → correct format applied from day one
No file transfers. No manual reformatting. The EDI message is a byproduct of the operational workflow — not a separate manual step.
Automatic tracking: System logs every EDI message sent, delivery status (accepted / rejected / pending), and error type when applicable. Live dashboard shows overall accuracy rate, messages pending revalidation, most frequent error types, and delays in EDI acceptance — no manual tracking, full traceability.
Actionable insight: Break down EDI accuracy by message type (movements vs. quotes vs. repairs). When rejection rates are higher on quotes, the root cause is often linked to pricing configuration or CEDEX codes — a good starting point for a targeted fix.
How to Read a Container Yard KPIs Dashboard
A dashboard is only useful if it changes what happens next.
The mistake is to stare at averages and call that management.
Averages are a starting point. Exceptions are where the work is.
1. Start with outliers
An average gate time of eight minutes may look healthy.
But if 15% of gate-ins take more than 15 minutes, that tail is where drivers are losing patience.
Find the long waits and ask what they have in common:
- Shift
- Customer
- Container type
- Paperwork issue
- Inspection requirement
- Equipment availability
- System delay
2. Look for the bottleneck
If turnaround is slow only in the morning, the issue may be staffing, shift handover, or inbound appointment clustering.
If it is slow all day, the problem is probably structural:
- Manual data entry
- Disconnected systems
- Unclear exception handling
- A gate process that asks one person to do too much
3. Compare customers
Customer comparison is often revealing.
One customer may average nine days of dwell while another averages four.
One may generate status requests every day while another barely calls.
That does not automatically mean one customer is difficult.
It may mean:
- Release documents arrive late
- Collection patterns are uneven
- The customer lacks visibility into depot status
4. Compare yard zones
Yard-zone comparison is just as practical.
If one zone has 95% positioning accuracy and another has 85%, investigate the difference.
The cause may be:
- Signage
- Lighting
- Operator habits
- Stacking pressure
- Cargo type assigned to that zone
A KPI should lead a manager back to the ground, not away from it.
5. Turn the number into action
“Gate turnaround is 12 minutes” is a complaint.
“Gate turnaround is 12 minutes because we manually type container numbers at peak arrival; this week we test OCR for inbound trucks” is an operational decision.
That is the point of a KPI dashboard: not more reporting, but better action.
Which Container Yard KPIs Should You Track First?
Trying to monitor every KPI at once usually creates a reporting project that nobody wants to maintain. Start with the problem that is already costing the depot time, money, or customer trust. Then choose three KPIs that expose that problem from different angles.
Start with gate congestion when trucks are backing up or drivers are waiting too long.
Track:
• Gate turnaround time
• Inspection completion rate
• Container positioning accuracy
Gate congestion is rarely only a gate problem. A slow inspection can hold the truck. An incorrect container position can delay release. Manual lookups can turn a normal arrival into a queue.
When yard space is the pressure point, focus on the KPIs that explain why the depot feels full.
Track:
• Yard occupancy rate
• Container dwell time
• Yard move efficiency
These KPIs show whether the depot is truly short on space or whether capacity is being lost through long dwell times, poor stacking decisions, and unnecessary rehandles.
For repair flow problems, start where inspection, estimation, and approval delays usually appear.
Track:
• EMR quote response time
• Damage detection accuracy
• Inspection completion rate
Repair revenue depends on catching damage early, documenting it clearly, and sending estimates fast enough for customers to approve the work.
Billing disputes require KPIs that connect invoices back to operational proof.
Track:
• Billing accuracy rate
• Customer status requests
• Container dwell time
Most billing disputes trace back to weak operational records: missing timestamps, manual entry errors, unclear service evidence, or customers who cannot see the history behind a charge.
When the office keeps answering the same customer questions, the issue is usually visibility or trust.
Track:
• Customer status requests
• Container positioning accuracy
• Inspection completion rate
Customers call when they cannot see the status, when they do not trust the status, or when the depot cannot give a clear answer quickly.
FAQ: Container Yard KPIs
What are the most important Container Yard Performance Metrics?
For many small to medium inland depots, the first three to watch are gate turnaround time, container dwell time, and billing accuracy rate. Together they cover daily flow, yard capacity, and revenue protection. If those three are weak, the depot usually feels it quickly in queues, congestion, and customer disputes.
How do you track container yard KPIs without adding admin work?
The cleanest method is to capture KPI data during the normal movement of work. Gate OCR records numbers and timestamps. Tablet inspections attach photos and damage notes to the container file. Mobile yard updates keep positions current. The reporting comes from those events rather than from someone rebuilding the day in Excel.
What is a good container dwell time for a small depot?
A 3 to 5 day average is a common internal benchmark for small and medium inland depot operations (loaded containers), especially where free-time terms are short. Containers beyond seven days should usually be reviewed by customer, status, and release condition because the cause may be documentation, communication, or collection timing rather than yard performance alone.
How can I improve my depot’s gate turnaround time?
Manual container number entry is often the fastest delay to remove. OCR-based gate workflows on tablets reduce typing, cut errors, and create reliable timestamps. Digital inspections, prefilled booking details, and digital interchange forms can then remove the next layers of waiting.
Why is billing accuracy important for container depot operations?
Billing accuracy protects cash flow and credibility. A disputed invoice can take longer to resolve than the original service took to perform. Depots that connect invoices to gate timestamps, inspection photos, EMR records, and storage calculations are in a stronger position because the charge is backed by an operational record.
How does yard management software help with container yard KPIs?
Think about the 10:30 rush, when three trucks are waiting, one customer is chasing a release, and the yard supervisor says the box is not where the system shows it. A good yard management system lets the manager see the live gate queue, the last confirmed position, the inspection status, and the dwell clock in one place, then decide whether the problem is the gate, the yard, or the customer release process. Without that view, the same manager is calling the gate, radioing the operator, checking a spreadsheet, and hoping the answer arrives before the queue gets worse.
Conclusion: Fix the First Leak
The best container yard KPIs programs do not begin with a perfect dashboard. They begin with one leak the team can see and fix: a slow gate, unreliable dwell data, parasitic yard moves, missing inspection evidence, delayed EMR quotes, or billing records that cannot survive a customer challenge.
Once the workflow captures the right data at the right moment, the KPI stops being a report and becomes part of how the depot runs.
If you had to defend one number from your depot tomorrow morning, which one would you trust without asking anyone to rebuild it?